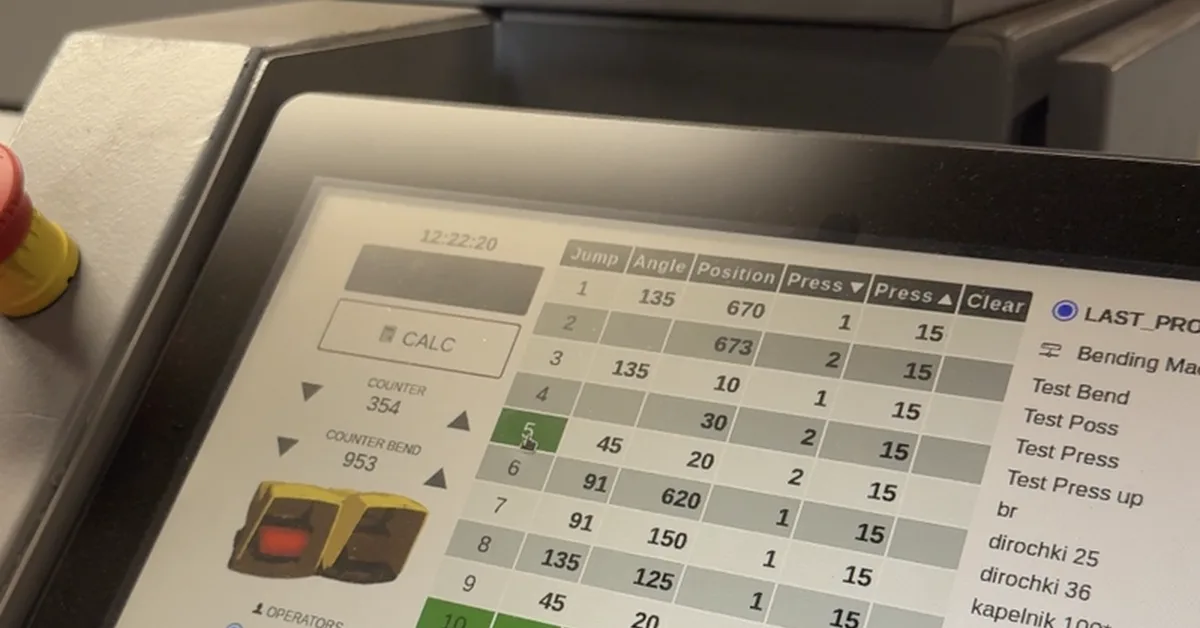
The project involved setting up a system to collect and visualize production data from bending machines without additional hardware. Using an ERP server, PostgreSQL database, and machine interfaces running jQuery 2.0, data was transmitted via custom JavaScript code injected into the machine's UI. After resolving CORS issues and permission errors, data collection worked as expected. Three visualizations were created: shift heatmap, production rate trend, and per-machine counter trend to provide meaningful insights from collected data.
Read the full article at DEV Community
Want to create content about this topic? Use Nemati AI tools to generate articles, social posts, and more.
13
Comments

Ali NematiWritten by Ali