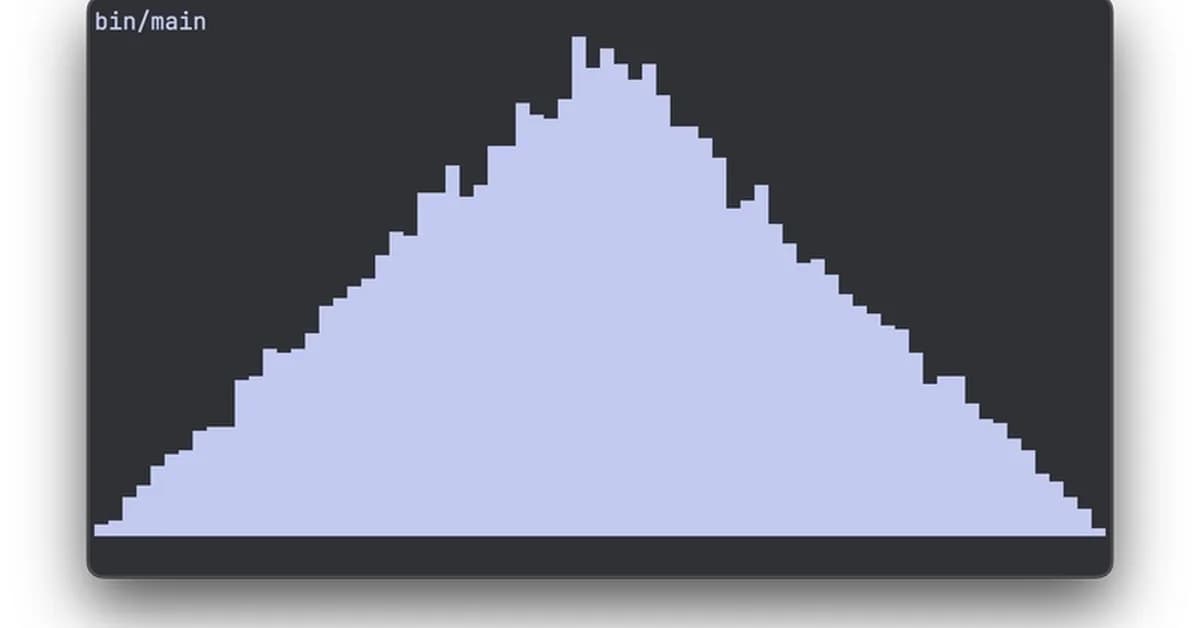
A C library, 'plt.c', has been developed to create terminal-based visualizations of data, specifically histograms, using Unicode block characters. This allows developers to quickly visualize the distribution of random numbers or other data without needing external graphics libraries. The library focuses on simplicity, enabling users to generate basic plots directly within the terminal for quick data inspection.
Read the full article at DEV Community
Want to create content about this topic? Use Nemati AI tools to generate articles, social posts, and more.
Views123

Ali NematiBlogUI.author_articles