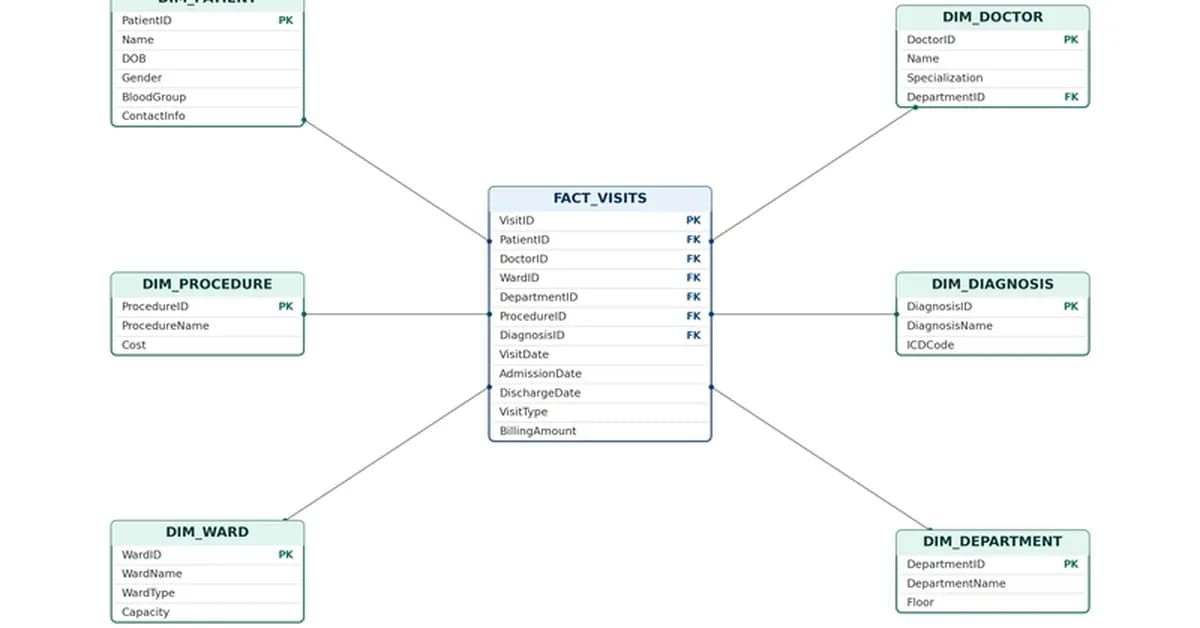
Businesses often collect large volumes of data that require analysis to inform decision-making. This guide focuses on Power BI, a Microsoft tool used to transform data into interactive dashboards, emphasizing the importance of a well-structured data model that defines how tables interact. The article details concepts like fact and dimension tables, star and snowflake schemas, and the significance of relationships and joins to effectively organize and analyze data, particularly within a hospital records example. Understanding these elements is crucial for data professionals building robust BI solutions.
Read the full article at DEV Community
Want to create content about this topic? Use Nemati AI tools to generate articles, social posts, and more.